
Have fun investigating Norwich River History!
If you haven’t had the chance, try the Rivers & Mills podcast driving tour!
Want to learn more about glaciers? Check out these National Geographic videos
Watch this Ice Harvesting video from Strafford
More Questions to Explore:
- How does water power work?
- How do our activities along a river impact others downstream?
Water Power at Blood Brook
Here at Blood Brook, there were two mills downstream from the bridge. In order for water to power the mills, there needed to be a strong flow of water and a height from which the water could flow. The greater the flow, the greater the height, the more power.
It’s the difference between the water level above the upper falls and the level below the lower falls that makes this an ideal place for harnessing waterpower. The mill owners also built dams along Blood Brook to increase the power. The dams created ponds behind which stored water and increased the flow. It made the waterpower more dependable during times of low water and drought.
From the millpond or falls the water was channeled to the buildings where it ran through water wheels. Click here to learn about the different types of water wheels.
Here is an animation of a sawmill, similar to the one that would have been here below the bridge.
The impact of water power downstream
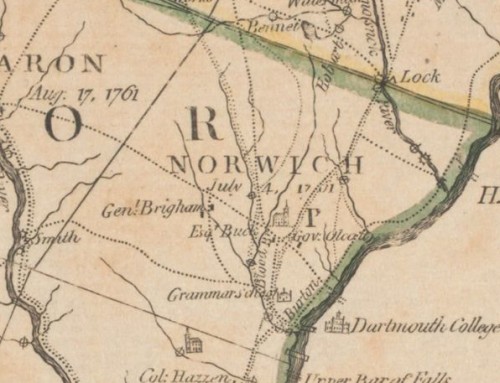
Norwich map, 1869; Detail of Norwich Village
On the map below or the online map, trace your finger along Bloody Brook. Can you find 2 sawmills, a tannery, and a gristmill?

Just above “Burbank & Crandall,” there is a small circle in the river with a black square—that’s a millpond. What do you think would happen to the mills downstream if the millpond’s dam above them was closed?
How do you think animal life would have been impacted by dams on the brook and by the waste flowing from the mills into the brook?
The impact of water power upstream
We often think about how a dam impacts communities and wildlife downstream, but what is the upstream impact? How did the building of Wilder dam impact this upstream area today?
Use the 1930 topographical map of the Pompanoosuc area to explore this question.
Go to: Topographical Map Explorer; enter in Norwich and zoom into the northern part of town where Route 132 intersects with Route 5 and the Ompompanoosuc River.
- Trace with your finger Route 5 on the modern topographical map
- Look closely at how the water flows, especially near Kendall Station Road.
- Now click on the 1930 map in the timeline. It will layer on top of the current map.You can change the transparency on the map in the bottom left corner.
- Here are some things to look at on 1930 crop of the Pomponoosuc area.
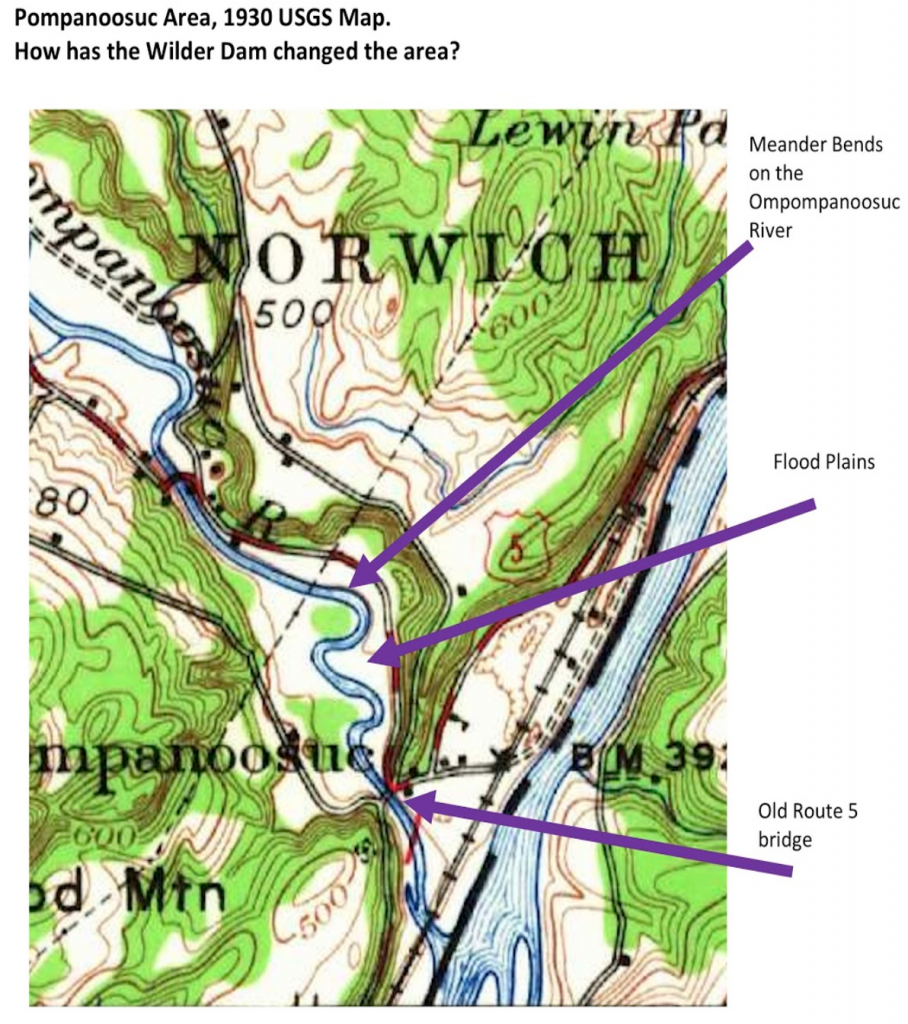
- Trace with your finger Route 5 on the modern topographical map
- Look closely at how the water flows, especially near Kendall Station Road.
- What has changed?
- How has the Wilder Dam impacted communities upstream?
Taking it further:
This video uses a river table to explain how rivers work. Have a sandbox? Try experimenting yourself.
